Adobe SiteCatalyst
Before we dig into dashboarding within Adobe SiteCatalyst (previously known as Omniture), a short introduction on Adobe SiteCatalyst:
Adobe SiteCatalyst is a web analytics application offered by Adobe. It’s part of Adobe’s Marketing Cloud and Analytics suite. It allows for predictive and real-time analytics that can be integrated within third-party sources. In contrast to similar products such as Google Analytics, Adobe SiteCatalyst is not a free application. It operates as a SaaS application.
One of Adobe SiteCatalysts key features is its possibility to create complete and custom dashboards in a very flexible way:
SiteCatalyst has a very extensive selection of separate reports with predefined scopes: pages reports, visitor reports, device reports, and so on. This is nothing extraordinary, as other tools such as Google Analytics offer the same. However, in contrast to Google Analytics, these reports are not ‘preset’. Within SiteCatalyst you have the freedom in adding to the reports only the KPI’s you are interested in. In turn, this makes it a lot easier to create custom dashboards with a specific scope.
In short, SiteCatalysts reportlet system allows users to quickly segment and filter large amounts of data based on certain KPI’s and add these reportlets to dashboards. This intuitive way of building dashboards is one of Adobe SiteCatalysts strong suits.
Now, how does one go and create a dashboard within Adobe SiteCatalyst? We will cover how to create a dashboard, present some best practices, and why it’s important to think ahead before creating your dashboard.
Think ahead
Before creating your dashboard, you should think about the goal and the use of the dashboard. Are you going to share the dashboard with a third party, are you going to export the data into a spreadsheet, or simply going to consult it in Adobe SiteCatalyst. You should construct your dashboard according to your end goal.
If you are going to share the dashboard with a third party (client), make sure the data is clear and understandable. Next to that also change the titles of the reportlets and add some visuals. This way you create a dashboard that will be understandable for third parties with no prior knowledge.
If you are going to export the data into a spreadsheet such as excel, it is important that you structure the data and reports in such a way that it makes it easily workable in excel when exported. This requires some trial & error testing to get it right.
If you are just going to consult the dashboard within Adobe SiteCatalyst, just structure it the way you like. Tip: you can also set your dashboard as your Adobe SiteCatalyst homepage. This is especially handy if you quickly want to check on your metrics when opening SiteCatalyst.
Now that you have decided on your goal, let’s move on to the actual creation of the dashboard.
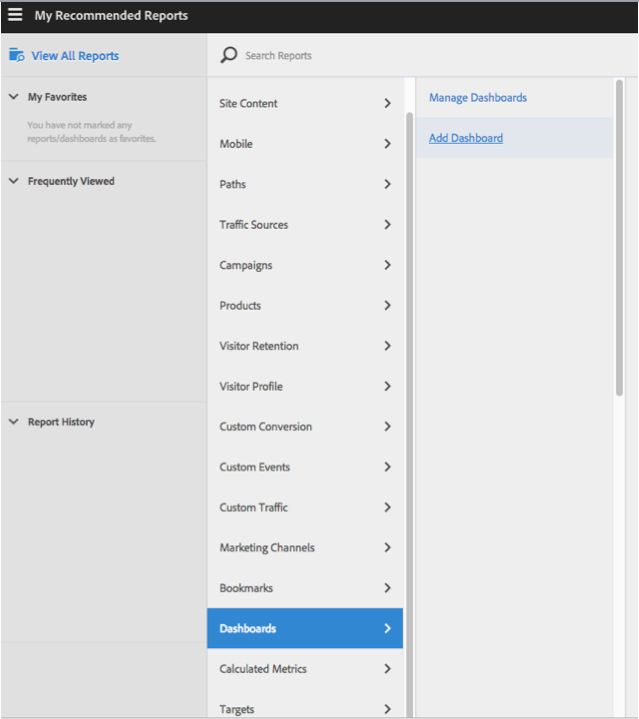
Creating dashboards in SiteCatalyst
- The first step is to create a blank dashboard. Click on ‘new dashboard’. This dashboard will be empty, but will serve as your dropping point for your reportlets. Give it a clear name, so you can find it back later.
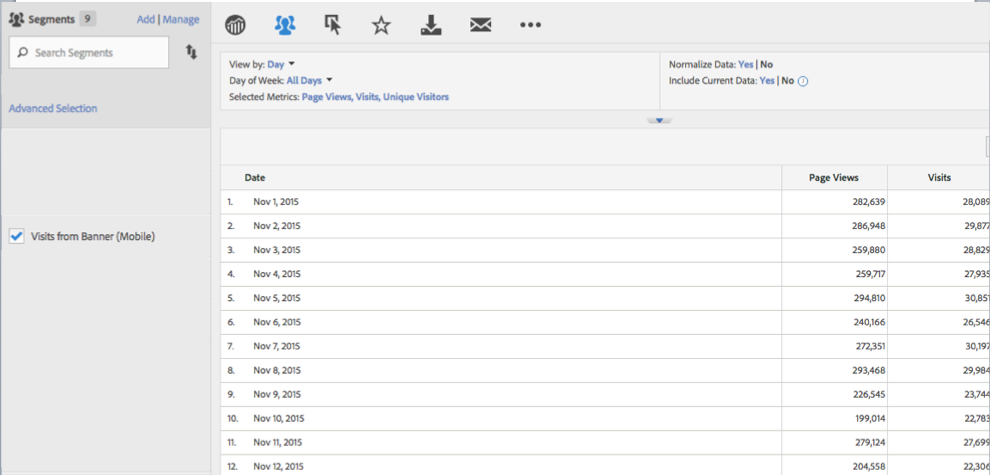
- Think about segments. For a lot of reports, applying segments is an efficient way to get your data. Map your segments and create them in the Segment builder. For example: we might create a segment for each traffic source and apply them on the visit report. Tip: Pay attention to the nomenclature of these segments. A good & clear nomenclature will keep your segment library clear.
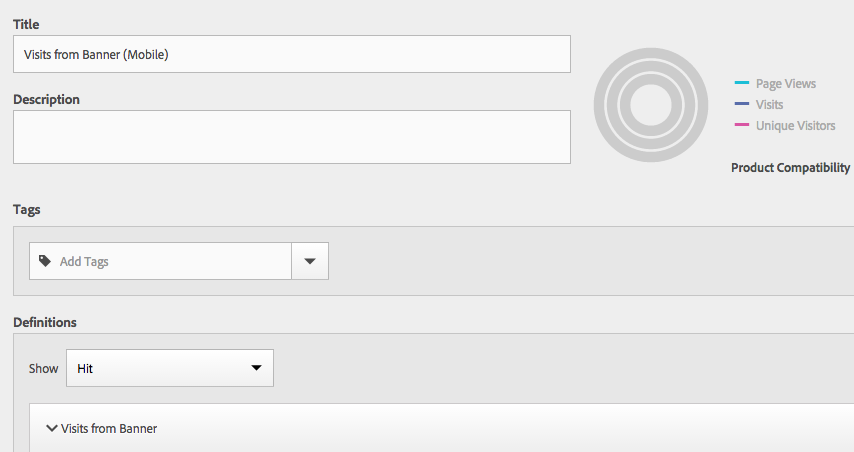
- Start creating your reportlets. Go to a report, add your segment you build in step 2 and add KPI’s.
- Add these reportles to your dashboard you created in step 1. A dialog will open where you can give a name to your reportlet, set the date settings and select the dashboard you want to drop the reportlet in. Select the one you created in step 1. Rinse repeat. Pay close attention to the nomenclature here. Give your reportlets clear names. A best practice is to include information on the segments, KPI’s used in the reportlet.
Now that we have all the reportlets in the dashboard, time to actually build the dashboard itself.
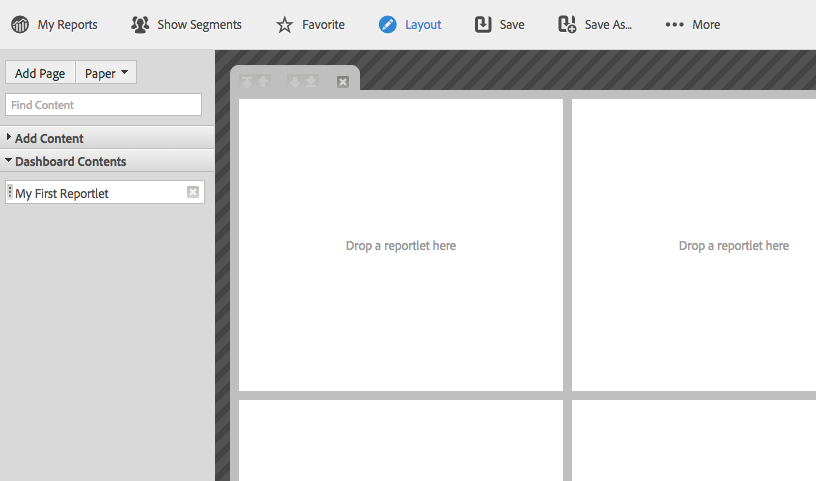
- Add some pages. Depending on the structure you can add 2x2 or 3x2 pages.
- Drag and drop your reportlets in these empty quadrants. Thanks to your clear nomenclature you should know which one to select and drop in its respective quadrant.
- Save and check your dashboard in the live interface.
Now that we covered both the ‘thinking ahead’ and ‘creating dashboard’ segments, let’s move on to some best practices.
Best practices:
- As mentioned above: think ahead before building your dashboard. Think about your goals and next steps.
- Before you start building the actual dashboard, make sure you think about the segments, filters and KPI’s you are going to use. Create a mapping of all these different elements.
- Create all your segments before moving to the actual reports. You can apply these onto your reportlets.
- Nomenclature: good & clear nomenclature for both the segments & reportlets is paramount. It allows you to work in an efficient way.
Author: Maxime Vandenbussche