Introduction
A few months ago I wrote an article on “enhancing ad campaigns with weather data”. The goal of this first article was to explain how, from a technical point of view, we were able to contextualize our sessions’ data in Google Analytics with weather data. The described purpose of this custom implementation was to measure the role/impact of weather on visitors’ behaviour on our website. Ultimately, answering the following questions:
- Which weather scenario(s) positively or negatively impact the visits on my website ?
- Which weather scenario(s) positively or negatively impact my online sales ?
The purpose of this second part is to share how we have been able to identify specific weather scenarios that prove to have an impact on our website’s performances. Moreover, the second goal of this article is to explain how we are now able to use those scenarios in order to optimize instantaneously in real time our advertising campaigns based on the external weather conditions/data.
Methodology
In order to determine the most important weather scenarios, we went through the following four steps:
-
The state of the sky - sunny, cloudy, rainy, etc.
-
The temperature
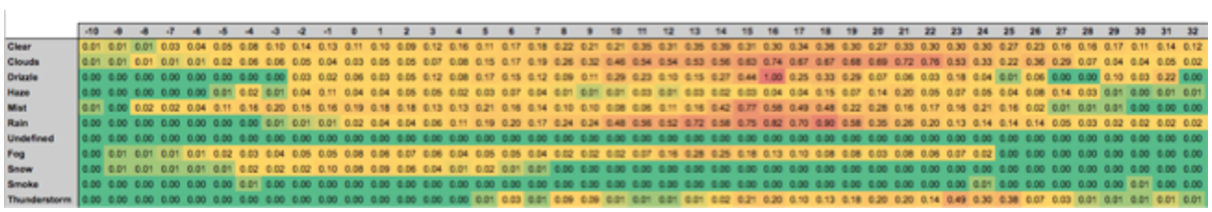
3) Visualise results - The third step consisted in building matrices and heat maps in which we could cross our metrics and dimensions in a visual way. In order to automatically retrieve all data (dimensions & metrics) and always have updated data, we used the Supermetrics add-on. The image below sketches an idea of what the final visualisation looked like:
4) Define most relevant test cases - Once the matrices were created it became easy to identify the most important weather scenarios for the different KPI’s indexes. In order to move on and start testing the real time optimizations on our advertising campaigns we decided to focus on two scenarios per KPI index. To give you examples, two of the defined scenario were the following:
- For product XX: “rainy weather with temperature between 11°C and 18°C”
- For product YY: “sunny weather with temperature between 25°C and 30°C”
With the identified scenarios we were able to move on to the third part of this project.
Output
As explained in the first article written on this subject, today, we still see a lot of marketers using their gut feeling to take business decision. Aside from the objective of enhancing our advertising campaign with real time weather data, the first implicit goal was to have data that would help challenge gut feelings and take business decision based on tangible facts.
- Activate/pause campaigns/adgroups/specific ads and/or banners
- Increase/decrease specific keywords’ max CPC
- Increase/decrease campaigns’ budget
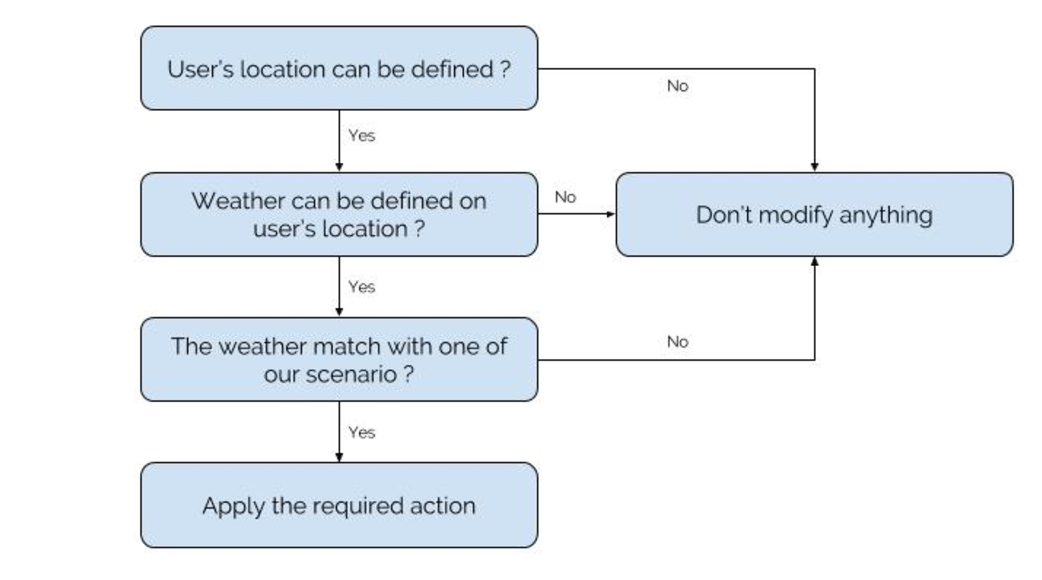
Of course, all those steps are being done instantaneously in real time. In terms of next steps, since the different scenarios and actions have just been launched on our advertising campaigns, we now need to follow-up on performances and measure the uplift it’s bringing to our campaigns.
Consequently, in a third article I’ll be covering the concrete results of our tests. Note nevertheless that this is an ongoing testing and learning process in which we will continuously refine our weather scenarios and the underlying actions.

Julien De Visscher
| LinkedinThis email address is being protected from spambots. You need JavaScript enabled to view it.