Analysing data is an art. Giving them a sense and actually going through the steps of “data, information, knowledge, wisdom” model requires expertise, experience and science. Having “information, knowledge, wisdom” without sharing it is just a pity.
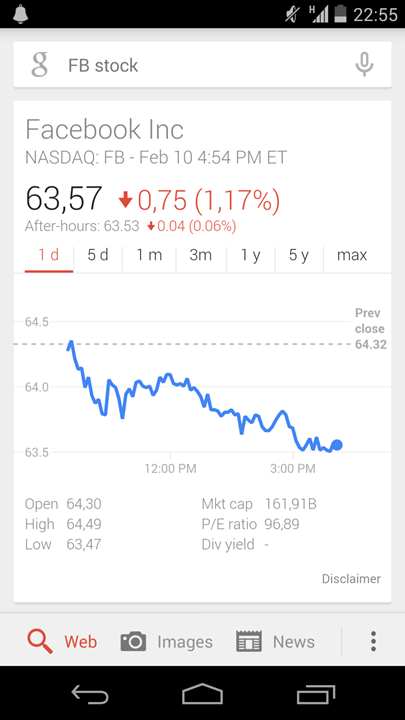
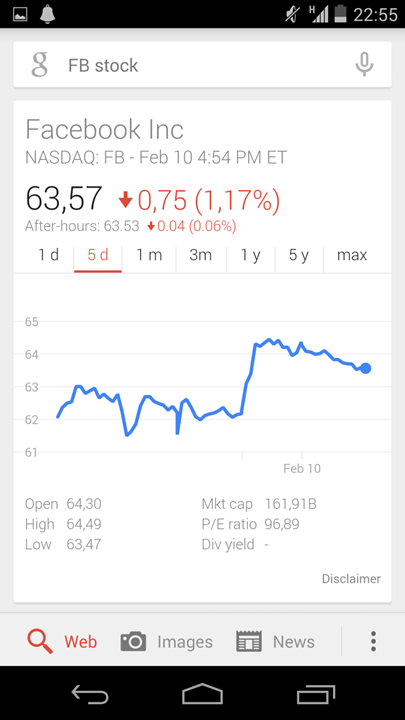
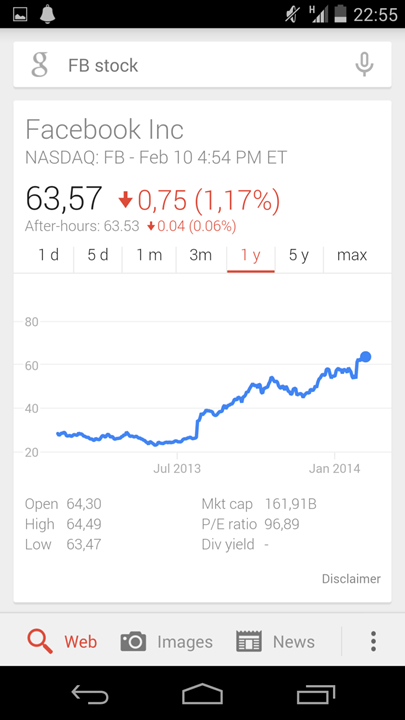
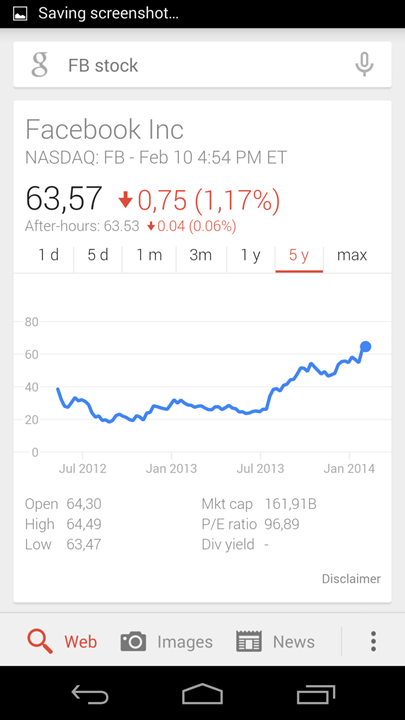
That is where visualization helps in the communication process to get easier and faster the “aaah ok, I got it!” moment. But here again making complex things looks simple is … not an easy task. It’s an art, it’s a job! Early February 2014, I had a look at the Facebook stock price evolution on my smartphone and performance for the last day looked very deceptive. Actually, adding context made me understand the data better. Facebook was not doing that bad after all:
 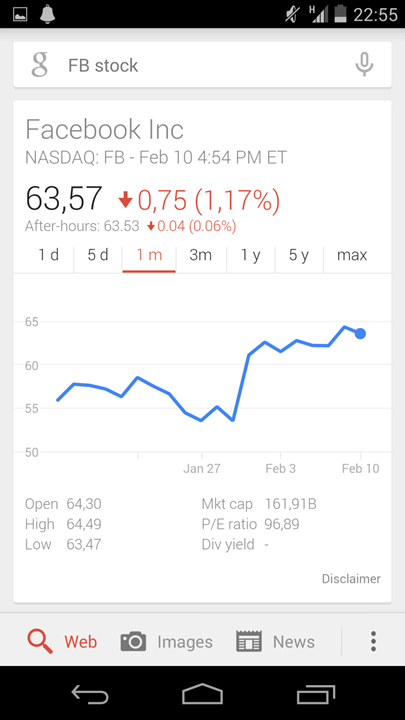 |
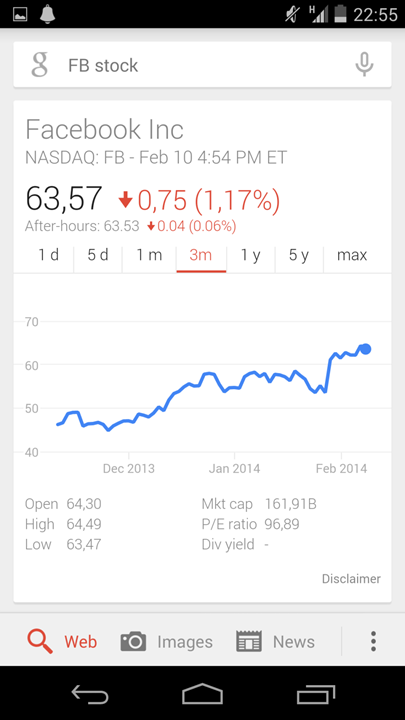
The trend was actually pretty good:
   |
What seems simple and smart often requires a lot of work behind the code. Facts checking, double checking but also industry knowledge and experience. This short example simply reminded me “All things are difficult before they are easy.” Thomas Fuller
![]() Written by Nicolas Debray
Written by Nicolas Debray


