
One of the biggest challenge digital marketing is facing, concerns the creation of value from the quantity of information. The data has to be reworked in order to extract valuable information for your business. It necessarily leads to a time-consuming process of retrieving, processing and analysing the data. These steps can last hours of work.
Digital marketing and web analytics are endless sources of information. Plenty of platforms are available, all having their own visualisation tool. Nevertheless, in order to have a global overview, a complex work of extraction and aggregation has to be done. In addition to that, most of the time those platforms do not enable you to create completely personalized graphs and reports adapted to your requirements.
One of the easiest solutions, which does not require a technical background consists in using data retrieval tools linked to spreadsheets as Google or Excel. Among those providers you have “Supermetrics” which is an add-on embedded in you Excel/Google sheet. The tool is available in three versions : a free light version only with access to Google Analytics, a paid pro version, giving you access to other platforms like AdWords, Facebook, Moz, Bing, Youtube, Twitter… or a superpro version that includes access to Doubleclick.
Why should you use Supermetrics ?
The main reason why you should use it is undoubtedly its easy of use. In fact, you will rapidly be able to create basic reports and dashboards meeting your needs. Moreover, its price is affordable with a pro version at less than 500€/year. Finally, you can share the document with other users and the level of access can be controlled.
How to install Supermetrics ?
The first step consists in installing the extension. For Google (sheet or doc), you have to go to Chrome Web Store and search for “Supermetrics” (link available here). In the case of Excel, a specific Excel sheet has to be opened to activate the add-on (here).
How to use Supermetrics ?
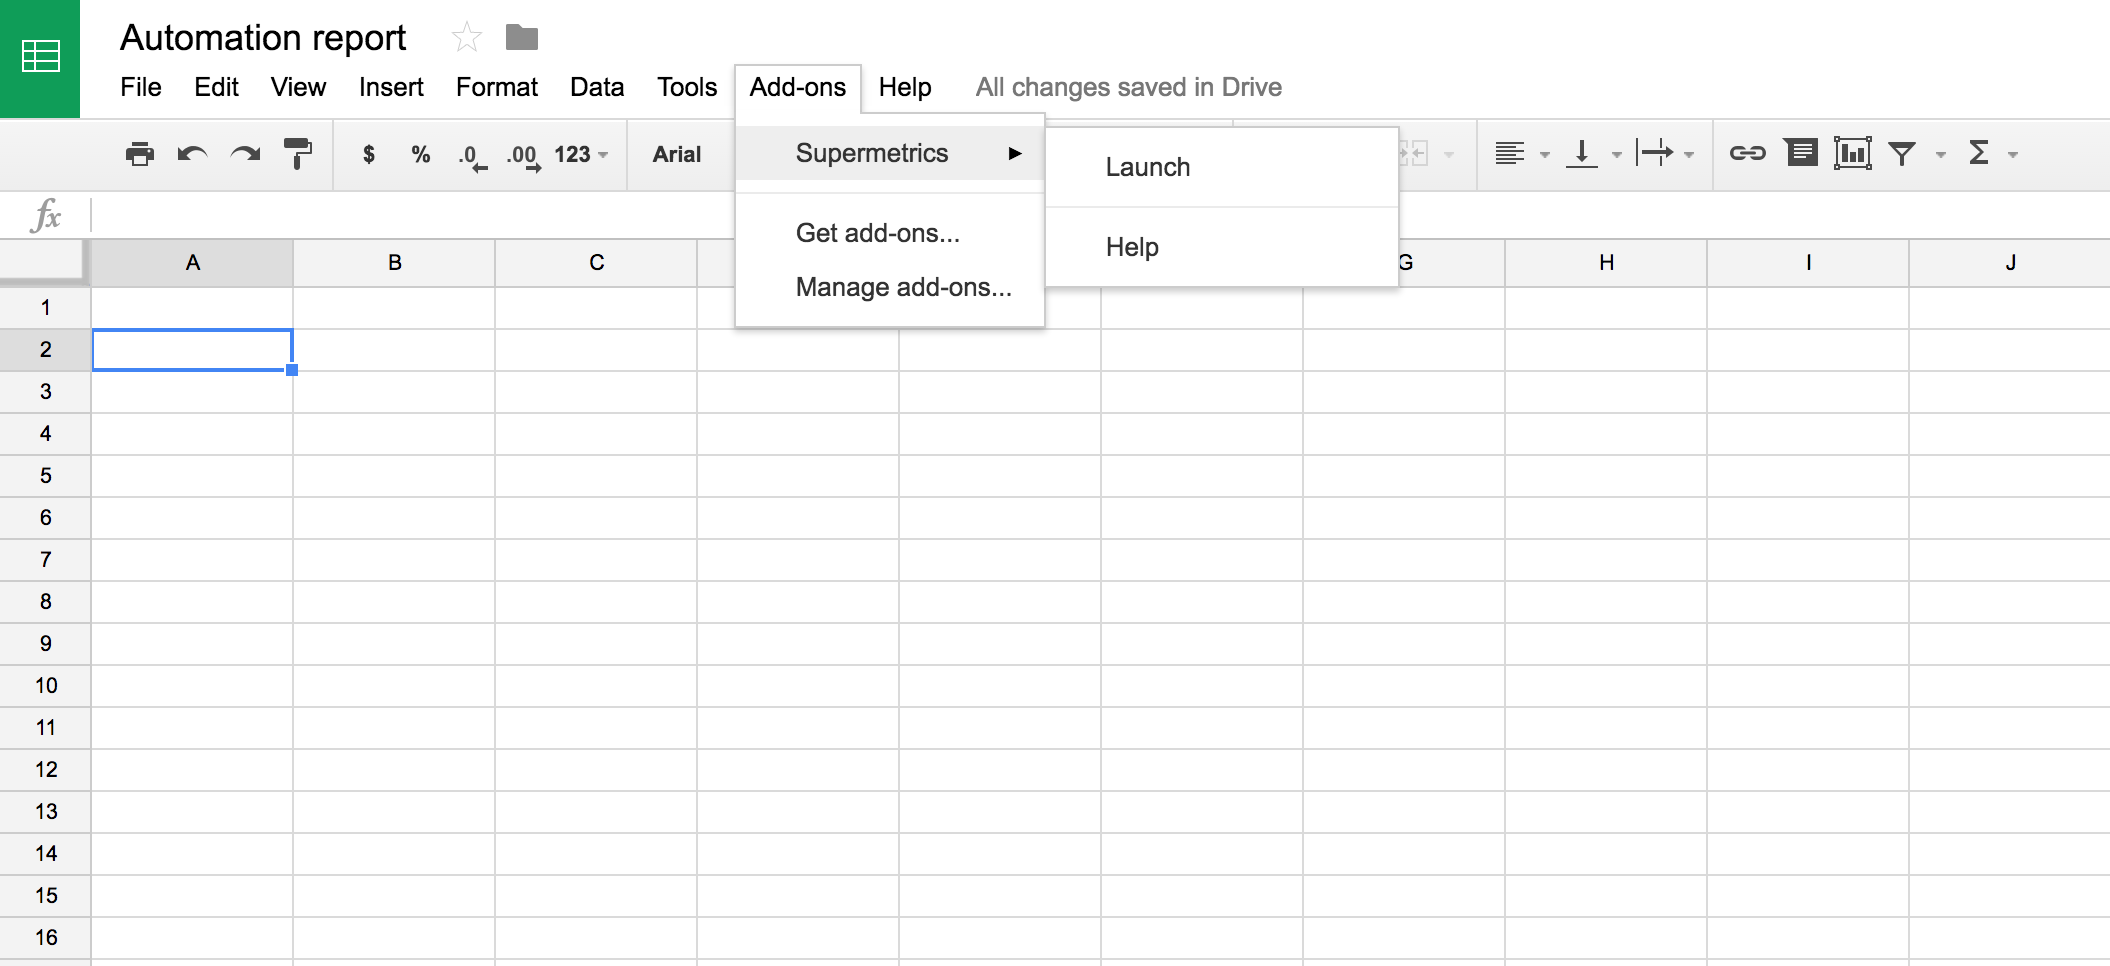
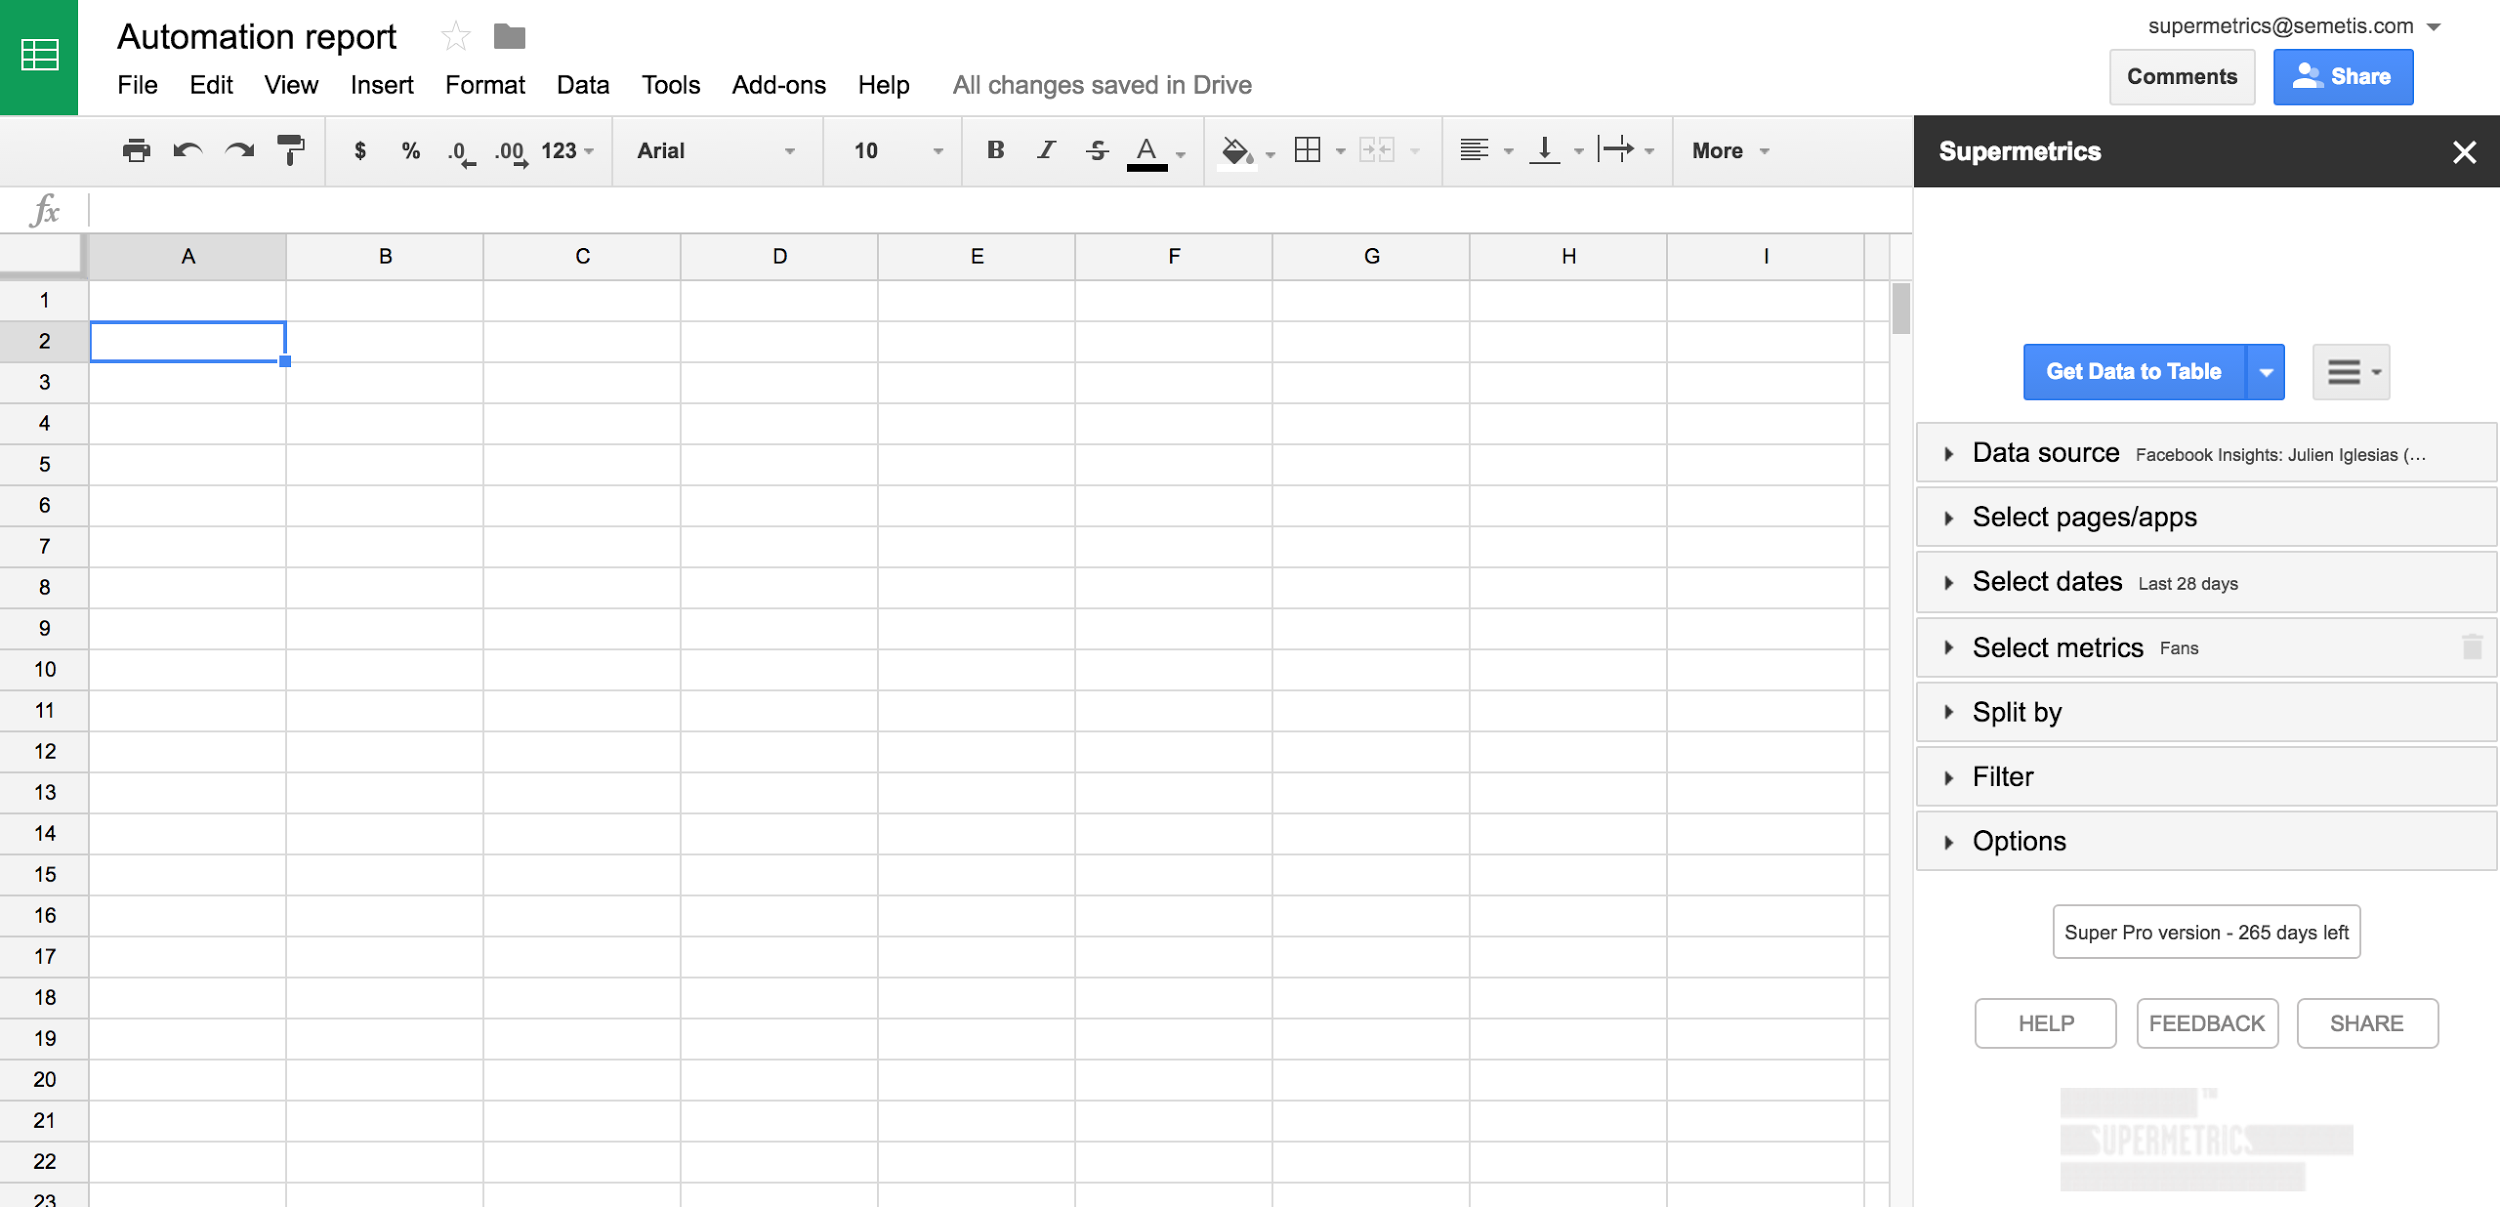
When you click on the launch button, a customizable query window will pop up. You have the possibility to select the data source (AdWords, Facebook, Moz…), the account, the date range and the metrics that you need. In addition to that, you can choose the criterias to split your rows and columns (for instance in AdWords: campaign names, months, type of device…) and you can apply filters based on simple rules as “greater than”, “equals to”, “does not contain”. Those parameters are crucial as it is then possible to create graphs and tables based on that.
How to create automated reports ?
First, you should define your final objectives. This step will allow you to decide whether you have to do a single analysis, create a dashboard or create a report. Moreover, you have to define your metrics according to your goals.
Secondly, the final wireframe has to be conceptualized (graphs, tables…). Imagining your visual is crucial to build your Supermetrics queries which have to fit with your final needs. We strongly advice to keep separate sheets for your raw data, your reworked data and your final visual. If you do so, you will keep consistency in your report and avoid any mistakes linked to the refresh of your data.
Thirdly, once your design has been thinking, you have to relocate and modify your data to make them fit with your graphs and tables. In most cases, it will be necessary to rework your data as graphs especially need a specific structure.
Thanks to Supermetrics you will be able to create reporting tools and personalized dashboards by combining data coming from multiple interfaces. In addition to that, the information will be automatically updated in a few clicks.
How to update your dashboard data ?
Once all your queries have been defined, you can go to add-on, Supermetrics and select “Refresh all” to update everything.
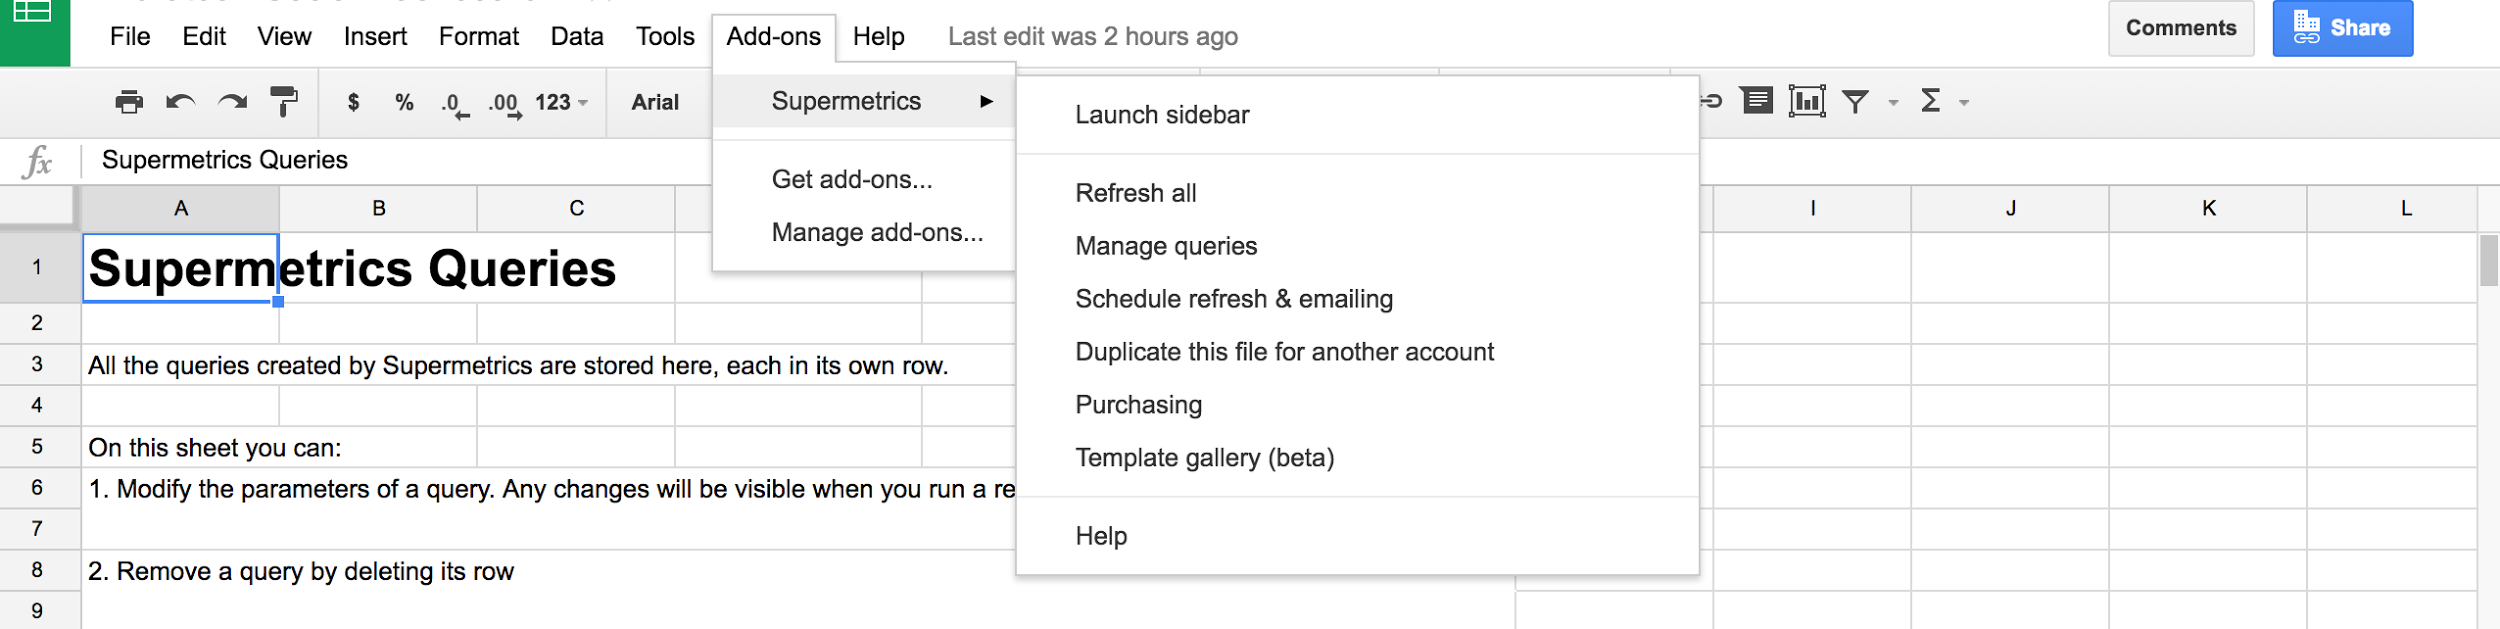
If needed, there is an option in the paid version of Supermetrics to schedule a refresh on a specific time range with the option “schedule refresh & emailing”.
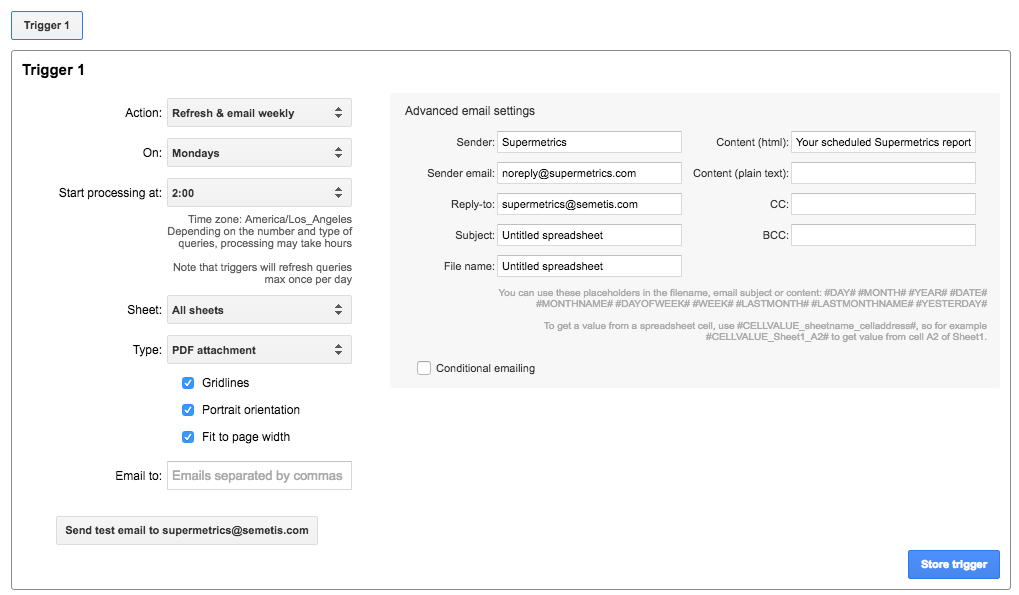
You can select the frequency, when it will start processing and even send the report to email addresses.
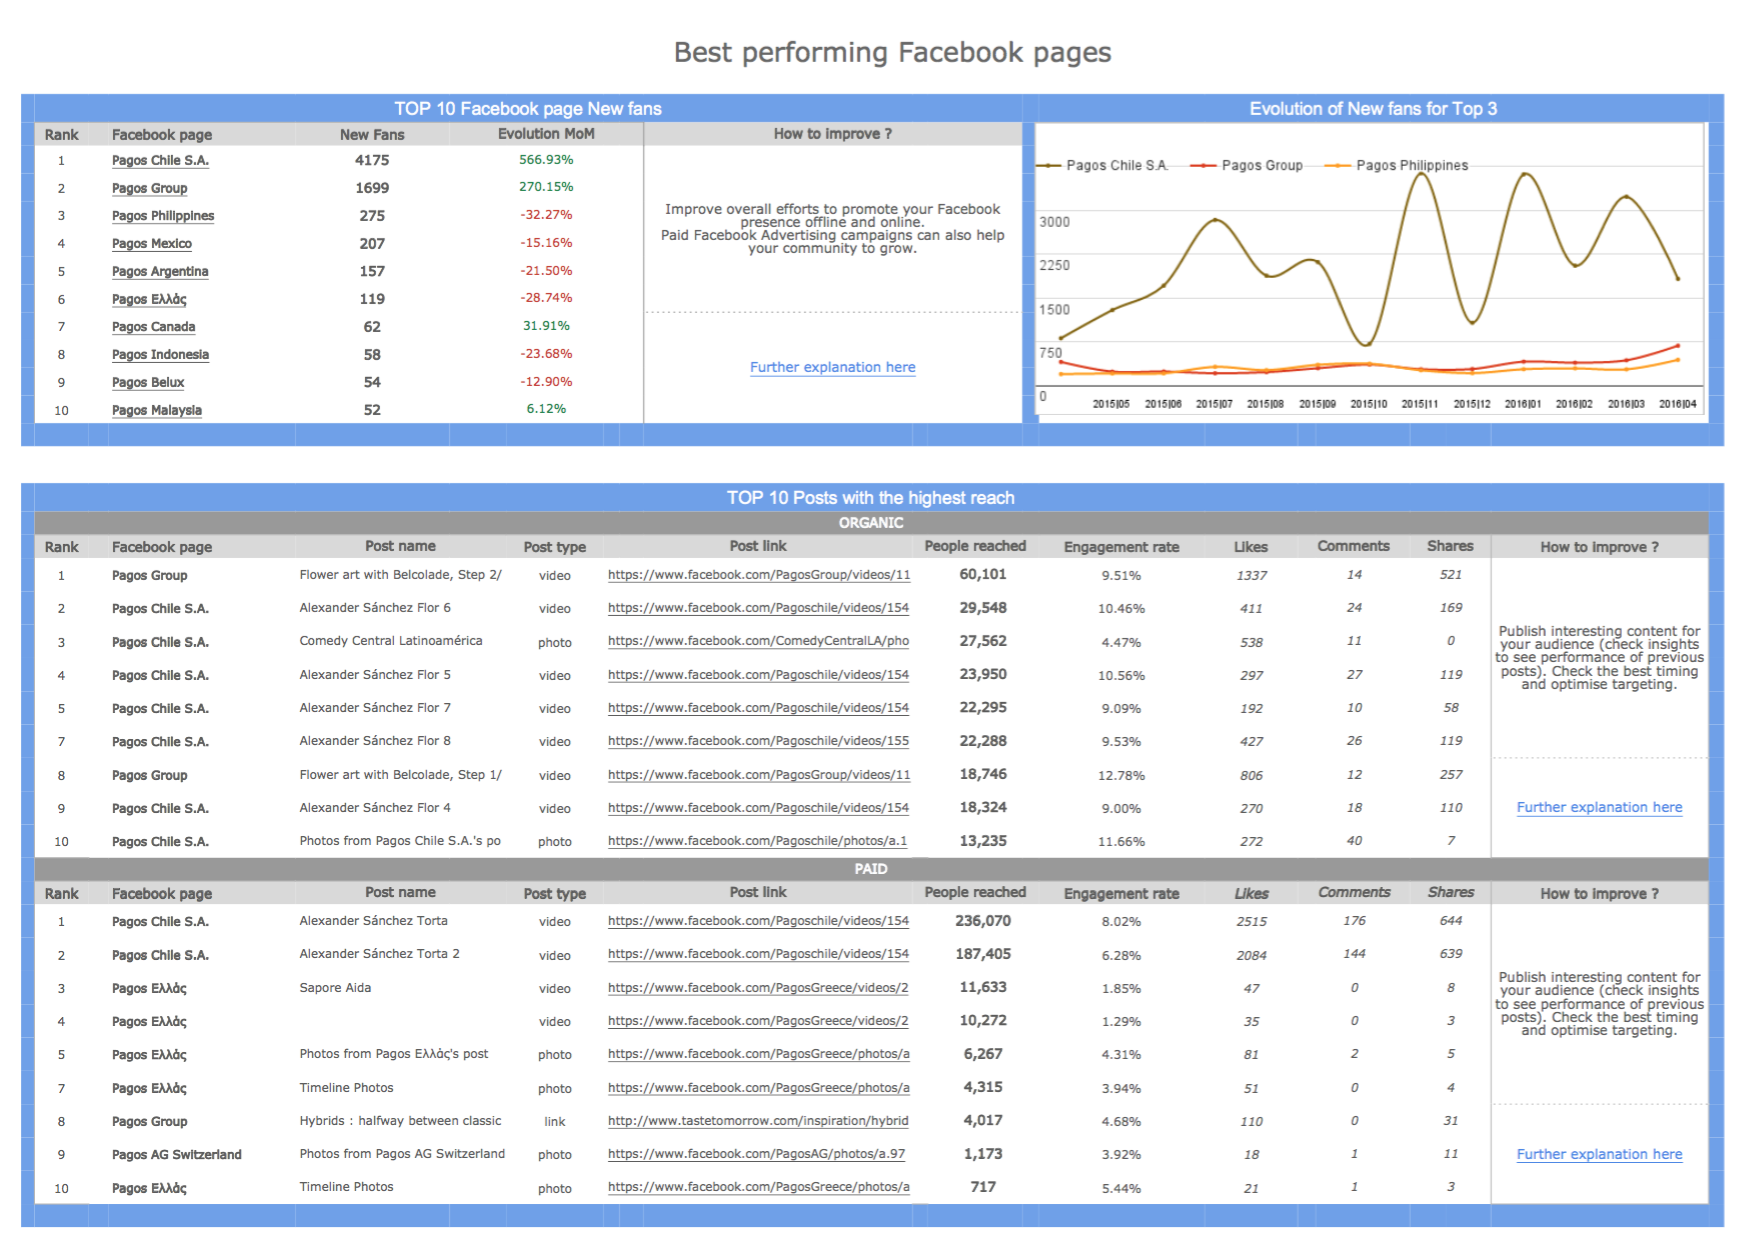
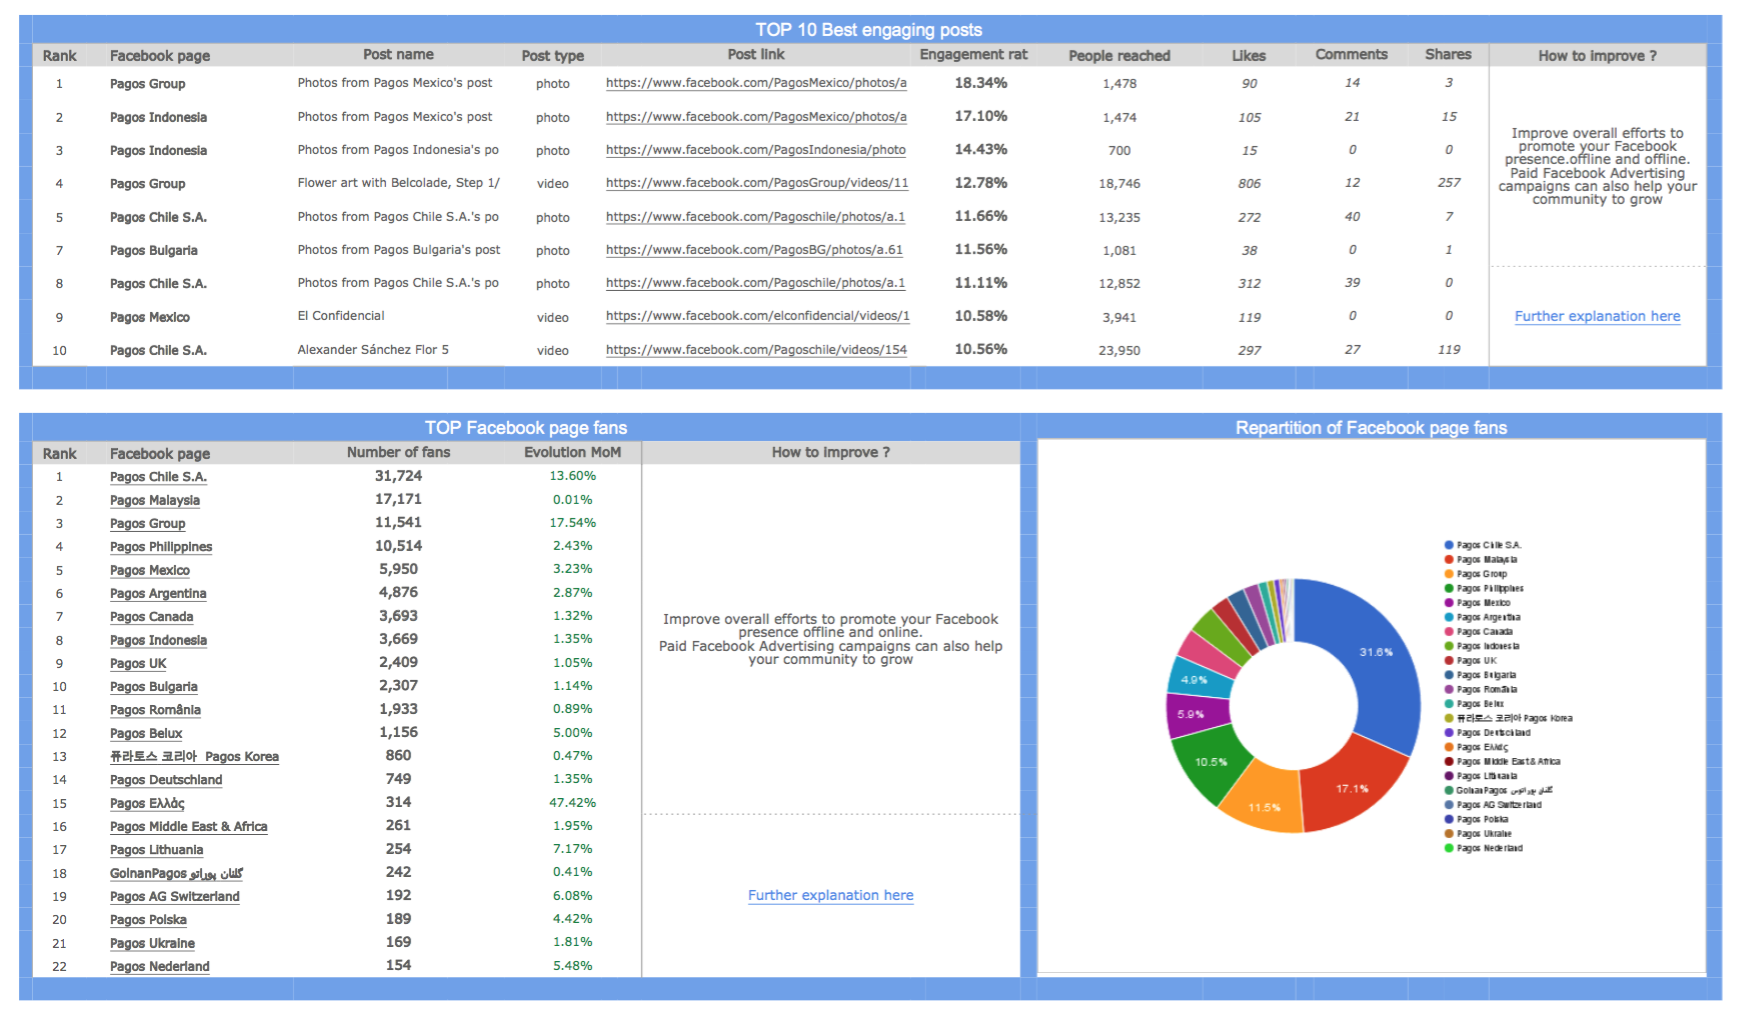
Example of Dashboard created with Supermetrics :
Tips and tricks
In order to succeed in your report and dashboard creation, we advise you the following best practices :
- Create separate sheets for raw data (from Supermetrics queries), reworked data and final visual
- Set a maximum of rows and columns in your query to well manage your space and prevent your query from overwriting other queries.
- Put a clear identifier for every query (color, frame) to easily recognize them in your sheet
- Work with the SupermetricsQueries sheet to easily see all your queries and do bulk changes
- Take your time to get to learn the tool. It might seem complex in the beginning, but after a few hours, you will easily find your way and make pro-reports in no time
Author: Julien Tesse