
Omnichannel is everywhere. A couple of years ago, this was a new phenomenon, but we’ve evolved towards a digital advertising spectrum where store visits are getting more and more incorporated in the marketing strategies and objectives.
Store visits
In short, store visits have the objective of linking the user who clicked an ad to a brick-and-mortar shop visit. Calculating store visits is as simple as this:
- A consumer signed-in and opted-in to location history clicks an ad
- This consumer then visits a store within a defined period of time
- A store visit is reported, aggregated & anonymized, and allocated to the ad click
From a technical point of view, GPS, Wifi triangulation, geometry, Wifi scanning and location history are used to define whether or not a consumer is going in-store. Note that within a certain interval of confidence, the data are extrapolated for the population. Finally in terms of accuracy, thanks to all tracked data, measurement is as accurate as 1 meter. It is consequently good enough to make the difference between someone who is hanging around your store, or inside your store.
Next to measuring the volume of brick-and-mortar store visits were influenced by your online investment, Google Ads offers a lot of extra interesting insights that provide valuable information for your business:
- Omnichannel ROAS
- Impact of distance on store visits
- Demographic profile of store visits
- From ad click to store visit
- New vs returning visitors
- Store visits data per individual store
Omnichannel ROAS
Knowing how many store visits are generated by your online investment, allows you to calculate an omnichannel return on ad spend (ROAS). By using a simple formula, we can easily extrapolate the data to estimate a total revenue generated:
Offline Revenue = # Store visits * In-store conversion rate * Avg Order value
Omni-channel Revenue = Offline Revenue + Online Revenue
Omni-channel ROAS = Omni-channel Revenue / Total marketing investment
Impact of distance on store visits
Analyzing the Distance report (Reports > Predefined reports (Dimensions) > Locations > Distance) can give you insights in the volume of store visits based on the user’s distance from your business’ brick-and-mortar locations when they click your ad. These insights could result in the following information:
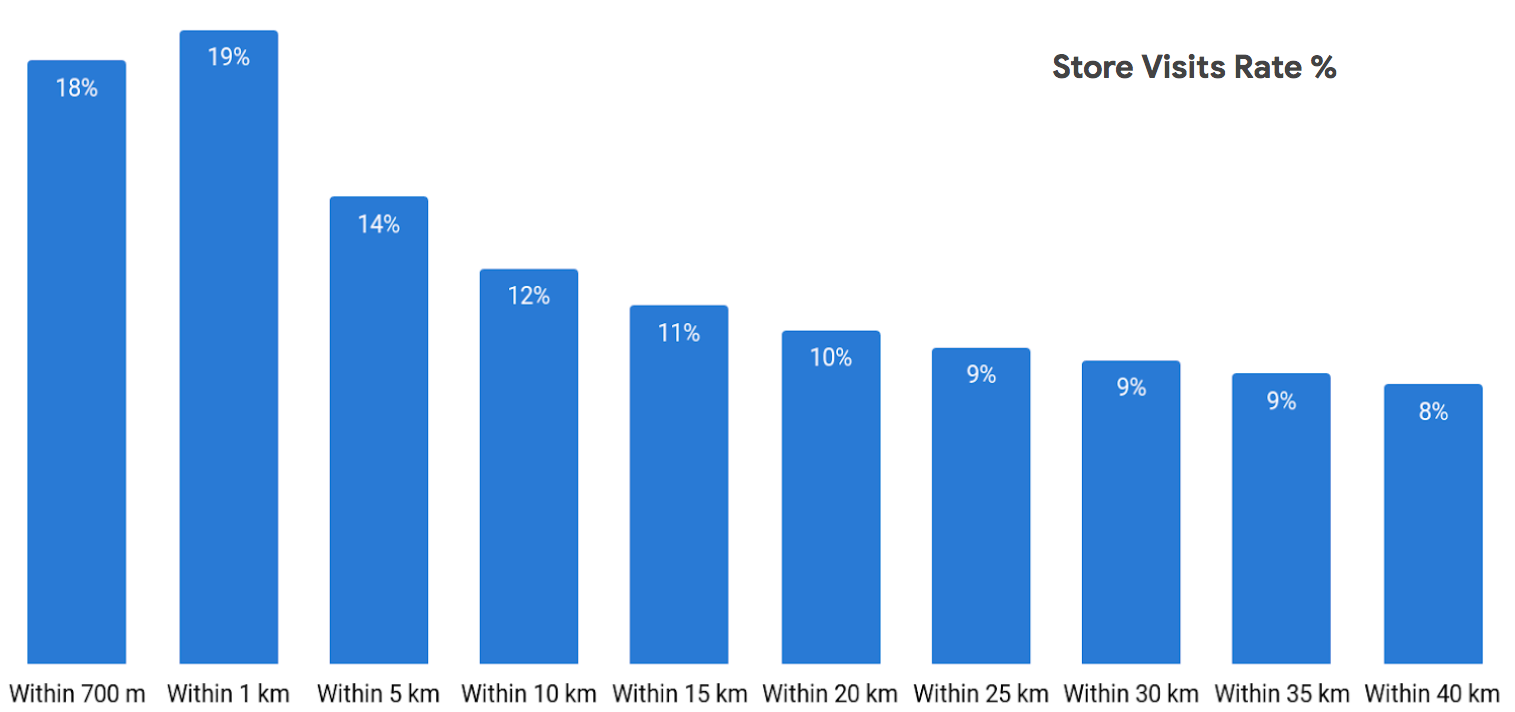
Based on the graph above, we observe that users who are closeby a brick-and-mortar store are more likely to visit the store. Based on this you can play with the messaging you send out to the user, to increase relevance. For users who are close to your business: focus on your brick-and-mortar stores. For the users who are further away: focus on your e-commerce (if relevant).
The demographic profile of store visits
Interested in knowing who is visiting your brick-and-mortar stores? Doing in-store analysis might be though and very time-consuming. So, why not analyse the demographic profile of the store visits driven by your online investments? Within the Demographics report you can easily segment your conversions focussing on the store visits. This can be done on account, campaign or ad group level.
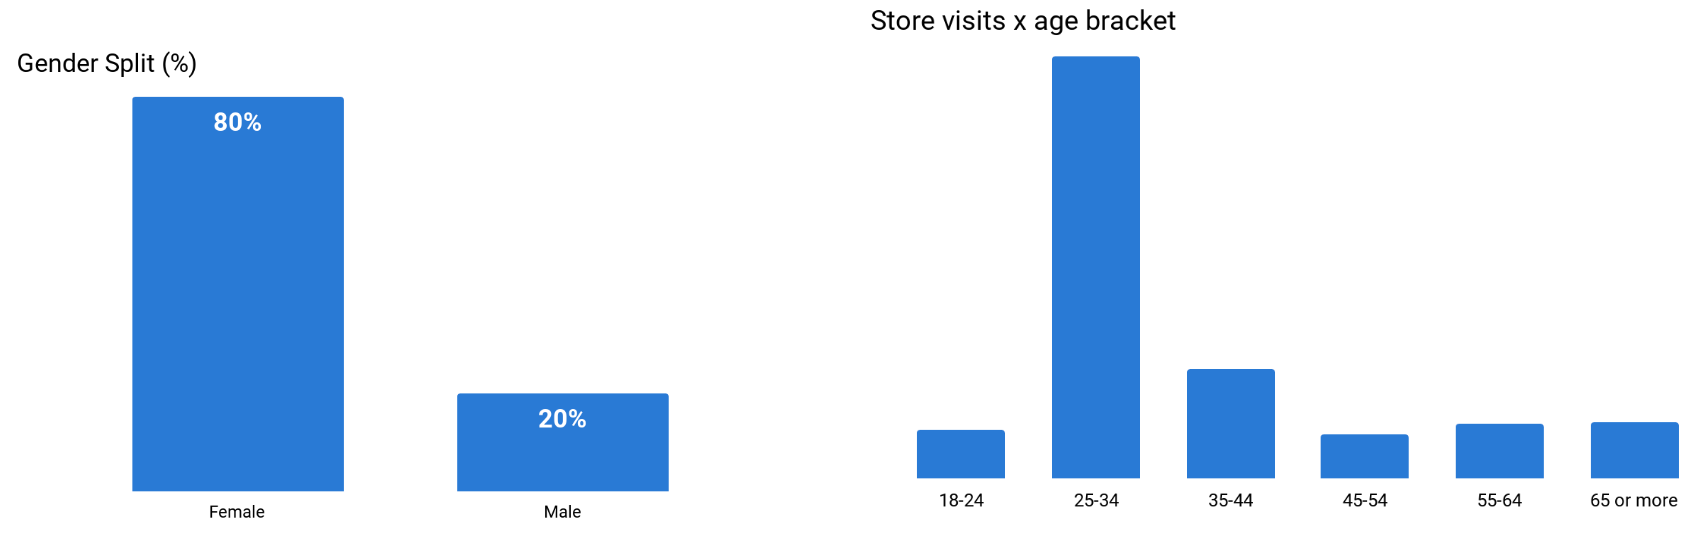
In the example above, we notice that store visitors are mainly women between 25 and 34 years old. Of course, these are interesting insights for you as a business in general, but you can also take this further into your online advertising by adapting your bid adjustments accordingly, to make sure you can reach your target audience.
From ad click to store visit
Analysing how long it takes for a user to visit your store after clicking an advertisement, can be consulted by adding the Days to conversion (Segment > Conversions > Days to conversion).
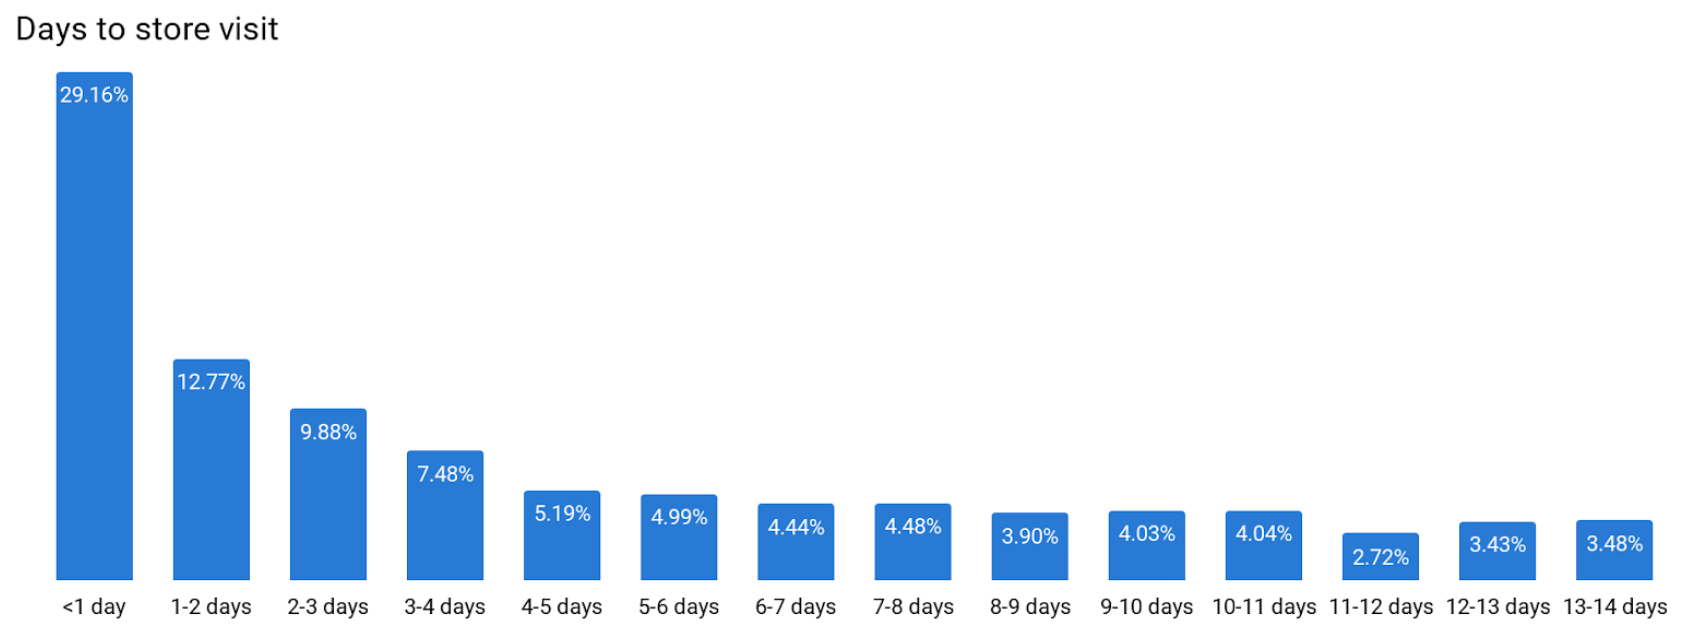
In the graph above, we notice that almost 30% of all store visits happen within 1 day after the ad click. This can be important to bear in mind when optimizing your ad copy. Knowing users who look for your business have a high intent to visit your store within a short time frame, it is important to include a strong call-to-action related to this. Also bear this in mind when communicating on temporary or short-term promotions.
New vs returning visitors
Adding the New vs returning customers segment to your store visits data gives you insights in whether the customers who visited your store after clicking an ad, had already visited your store before. “New” is in this case by default defined as a customer who has not visited your brick-and-mortar store in the previous 6 months. The lookback visit window can be adjusted to any period less than 6 months.
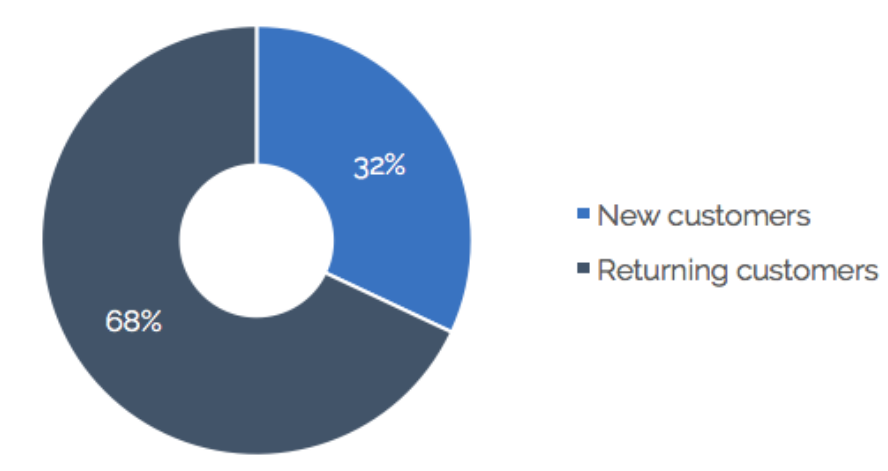
This type of insights can be useful to answer a question that often pops up in the context of store visits: “Would the users who visited my brick-and-mortar store not have visited the store anyway, also without having seen an advertisement?” Based on the data above, we could state that for at least 32%, the online investment has most probably caused the store visit.
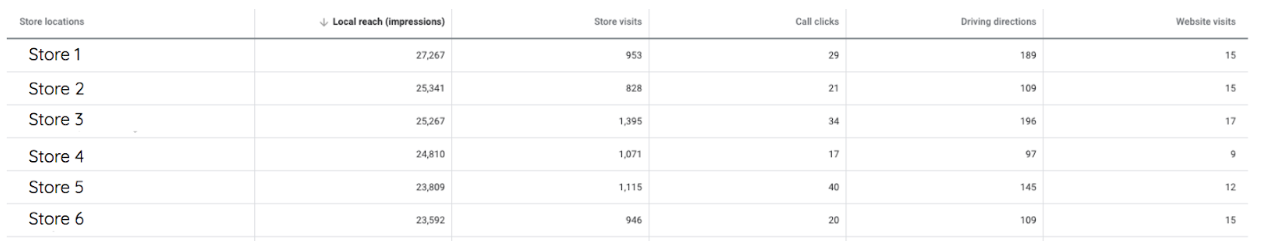
Store visits data per individual store
As a retailer with multiple brick-and-mortar stores, it is interesting to know how which are the best performing stores in terms of footfall traffic. Good news! Google Ads provides insights such as reach, store visits and call clicks per store. To have a look at these mterics, navigate towards Locations > Geographic report > Per store report.

Lieze Vande Keere
| LinkedinThis email address is being protected from spambots. You need JavaScript enabled to view it.