In Google Data Studio, you most likely have multiple conversions you want to report on. Either you have a webshop for which you want to track your sales, but you also want to track other micro conversions, such as people adding an item to the cart or people simply clicking on product details. If you’re a B2B player, you might want to track your lead forms, as well as people downloading a whitepaper.
Let’s take the latter as an example. For a B2B company, we want to have an overview in Google Data Studio of all our lead forms, as well as our whitepapers downloaded via our Google Ads campaigns. Both of these conversions are tracked directly in Google Ads. They are two of our most important conversions and we need to report on them separately.
Next to the conversions, we also want to have a view on clicks, impressions, cost per click, click-through-rate, CPM and the cost per campaign.
If you want to have conversions directly coming from Google Ads, you can only add the metric "Conversions", and not a specific conversion, like you can see in-platform. Therefore, what Data Studio actually does, is count up all the conversions you have in your account and link them to campaigns, ad groups or whichever dimensions you want. If you want to look at a specific conversion, you have to filter via "Segment Conversion Type Name".
What's the issue? Well, there are two actually:
- If you filter on one conversion, it filters all metrics you put in a table. So it will only take into account the clicks, impressions etc. that are linked to the conversion you filtered on. It's fairly similar to what you have when selecting a Segment in Google Analytics. Most of the time, this action will even give you a Data configuration error.
- You can't split out separate conversions in two, since your filter will automatically be applied on all metrics in the same table.
What's the solution?
The easy solution would be to report on your conversions in different tables, but if you want to have all your conversions in one table without splitting them out (which is the preferred option here), you can fix this via Blended data.
Here are the different steps:
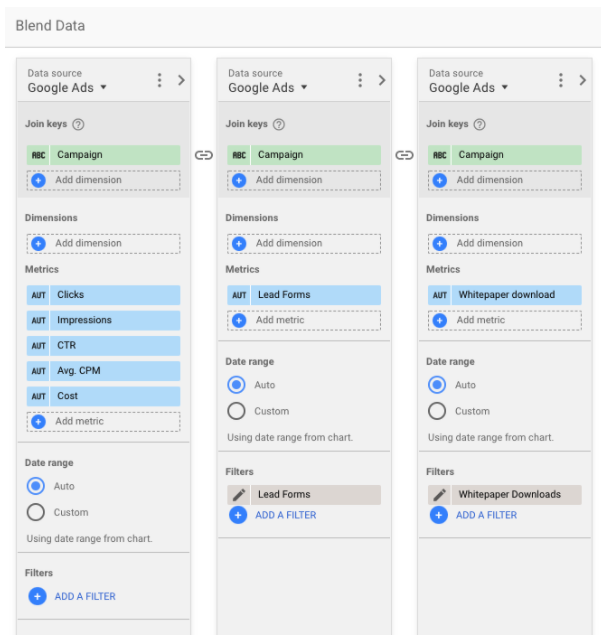
- You select all your dimensions in your first data source together with all the metrics you want to leave unfiltered (i.e. non-conversion related metrics like clicks, impressions etc.).
- You select conversion 1 (in our case: Lead forms) with the same dimensions, which you put as "Join keys". In fact, if you're using the same data source, you can use all your dimensions as Join keys. On this data source, you filter on your conversion name via "Segment Conversion Type Name".
- You do the same for conversion 2 (in our case: Whitepaper downloaded).
- Repeat for how many conversions you want to report on.
The result should look like this (Note that I have renamed the metrics “Conversions” to my conversion naming in data source B and C. The metrics are the same in both data sources, only the filtering is different.):

This way, you can have your Lead Forms, Whitepaper downloads and other conversions in one table, without the filtering affecting your other metrics.


