Google released a new Google Search Console interface in order to help users monitor the traffic of their website and help Google crawl the website. For the moment, it is only available in a beta version with few features. The beta GSC has five new reports: Index Coverage Status report, AMP status report, Job postings status report, Sitemaps report and Performance report. Through this article we will explain how you can take advantage of those new features in order to improve the monitoring of the website traffic and rectify shortcomings.
If you are used to the old version, this new interface is a game changer. In addition to be more user friendly, you are able to get up to 16 months of data. Thus, it enables you to better understand seasonal trends of your website and have YoY comparative analysis. For the moment, the new interface does not have all the features available in the old version. Therefore, for some reports you will have to go back to the old version. However, we should expect a full integration in the coming months. Analysing the traffic of a website has never been easier.
Taking into account that for instance Google represents 95% of the traffic, this improvement just gave means to the SEO specialists to better optimise websites traffic. You must wonder why I am so excited by the new interface, so let’s get our hands dirty through an example.
Status - Homepage
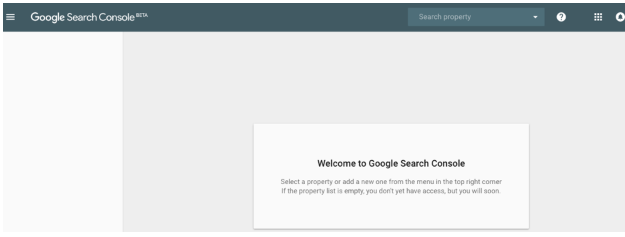
Let’s say you own a website that covers regional news. Once you are in beta version of the Google Search Console, you have to select the propriety (top right corner).
Afterwards, you get to the main view “status” where you have access to a global overview all the new reports: performance, index coverage, and enhancement (AMP, Job posting) reports. On the top right of each report, you are able to get more granular information by clicking on “OPEN REPORT”. Nevertheless, if you want to get first through the documentation, on the top right of the view your have a question mark. Just click on it and you will have a popup window (if you are familiar with the new Adwords interface, it is the same principle).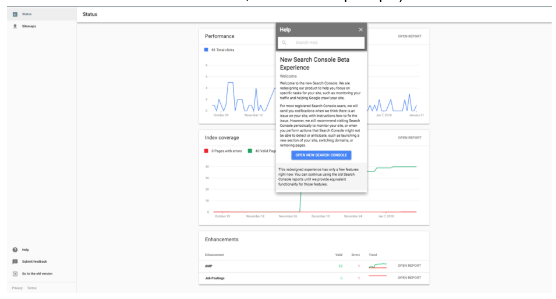
With this first report (Status), you have a global overview of the traffic, with the performance report, index coverage and enhancements (with the AMP report (Accelerate Mobile page) and Job Posting). On the right side, you have access to the sitemaps report which in the past was hidden under the Crawl segment. In addition to the Status and Sitemaps views, we should expect more views in the future.

You can already see from the start that the focus is on data visualisation, simplification of the tool (improve user experience) and educate the user how to navigate through the report with the documentation embedded in the interface. Through the third tab (enhancement) Google give a glimpse of its next focus with the integration of the AMP and Jobs posting reports (for the moment, it might evolve in the future).
Performance report - GSC new interface
In this report you have two tables. The first one with the main metrics (clicks, impressions, average CTR and average position) and the second one with queries. With regards to the old version, the new interface emphasises on metrics.
In order to filter your data, you have two default dimensions:
- Search type: Web (same as in the old version);
- Date: Last 3 months (28 days in the old versions).
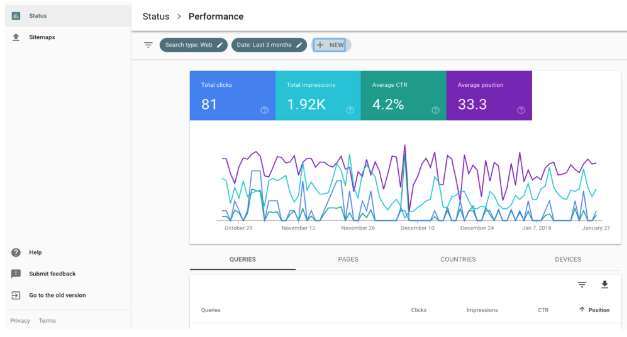
In the performance report you have several elements that you could analyse.
- You are able to filter your data based on the search type : web, image or video (same as in the old version).
- You can choose a custom period for your analysis and compare with another period. With regards to the old version, you can now compare up to 16 months (you have access to more data with regards to the old version).
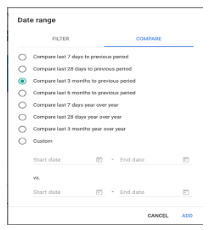
- In addition to those mentioned above you can filter based on queries, pages, countries and devices (same as in the old version).
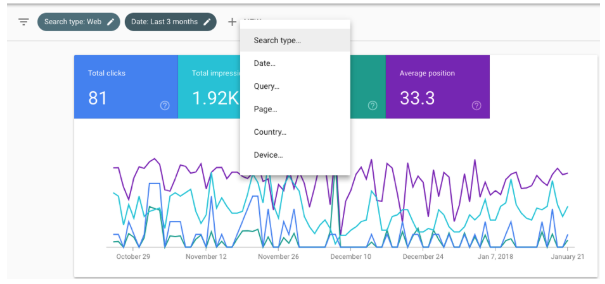
- You have also a second table where you can have a deeper understanding of the traffic since you are able to filter your queries based clicks, impressions, ctr and position.
The performance report is comparable to the Search Analytics report in the old version
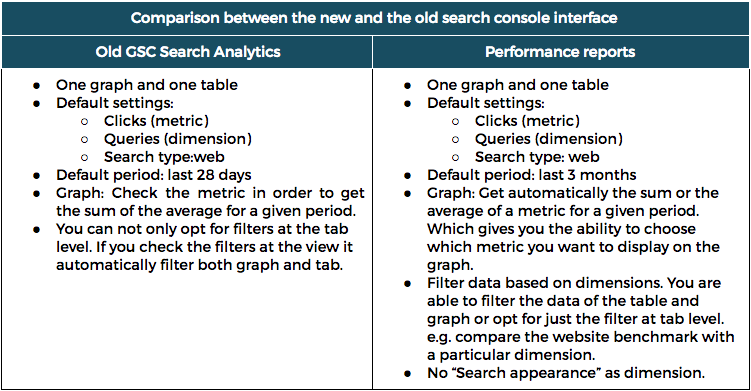
Let’s take our example to illustrate the advantages of the performance report. As mentioned you own a website that covers regional news. In your region there is a music festival in June that you promote through several articles. This year, you decided to start the promotion earlier by starting the publications in January. In March, you are wondering if they perform better with regards to the website benchmark and how you could improve the traffic generated. Thus, you decide to open the performance report.
Firstly, you compare your website data YoY in order to verify if there is a change. Secondly, at the tab level you implement a second filter to compare the performance of queries related to festival and see how they perform with regards to the benchmark. By doing so you noticed that YoY queries related to “public transport to the festival” are performing better than last year and the CTR is higher to the benchmark. Thus, with just two filters you are able to identity that you should write a article regarding the best way to get to the festival with the public transport.
In summary, the new performance report has a better data visualisation and through filters it helps you to save time for your analysis. So that you can quickly and easily translate insights into actionable elements.
Index Coverage - GSC new interface
You also have a graph and a table. The first one helps you monitor the evolution of four status while the table helps to have a deeper understanding of the status. This report is a combination of the “Google Index and Crawl” in the old version. One of the key modification is that you can in the new interface filter your index results by the mechanism through which Google discovered the URL(all known pages, all submitted pages and specific sitemap URL).
Moreover, with segment “reasons” in the table you have an explanation of the reason why your URL was not indexed. This something totally new. In the old version you only have the evolution of the indexation of your URLs. In order to see which URLs were concerned, you had to download URLs from the Crawl Errors report. Thus, the new interface allow to save time by enabling you to filter your data and understand faster the root of the errors/warning.
The URLs are classified in 4 status:
- Error: report on pages that couldn’t be indexed for some reason. By improving this area could drive more traffic to the website.
- Valid with warnings: Pages that were indexed but on which there are some issues. Google flags those pages since they are indexed. This gives you the ability to remove them in case you didn't want that they appear in Google Search.
- Valid: Pages that were indexed. Thus, you are able to see the evolution of the indexation overtime. This is not something new.
- Excluded: Those are the pages that were intentionally not indexed. You can have more details in the table where each elements is explained.
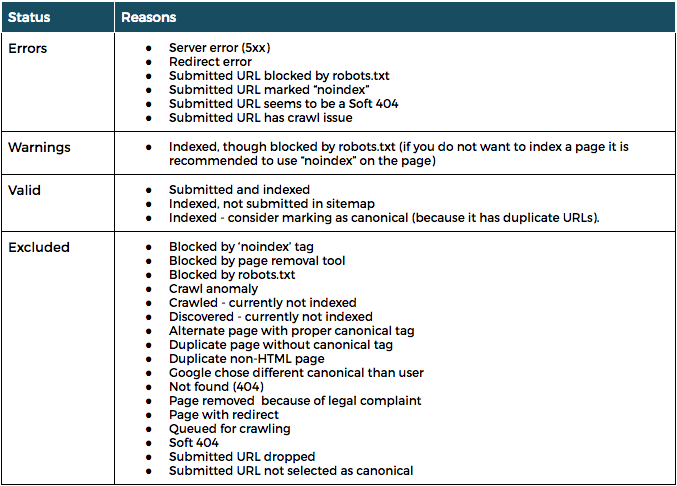
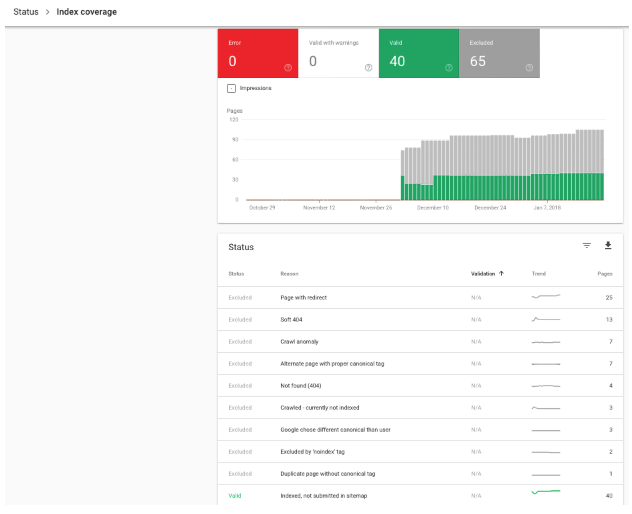 For instance let’s take the first reason of exclusions “page with redirect”. You are able to get examples of the urls that were excluded (which was not the case in the old version).
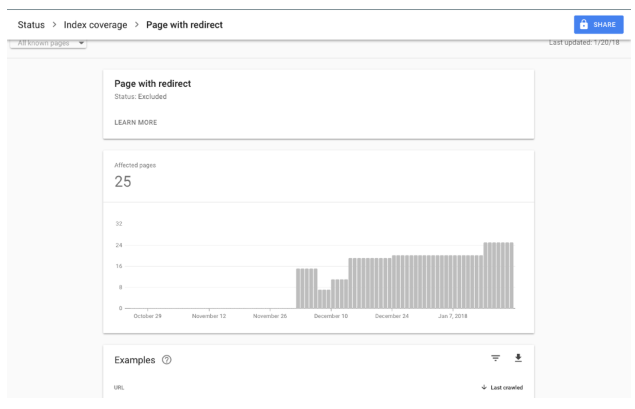
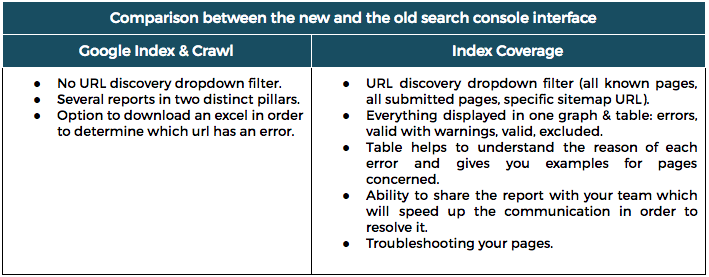
Let’s take back our example. So you run the performance report and identified that you should write an article regarding how to get to the festival with the public transportation. However, after few days you noticed that the new articles are not appearing in Google. Thus, you decide to use the new Google Search Console in order to find the root of the issue. In the Index Coverage report, you filter your data based on all submitted pages. Then you select the status “Excluded”, you find that actually your page were excluded because they have a “noindex” tag. Thus, in just few clicks you were able to directly identify the issue without being forced to download a report or used an external tool.
Enhancement - GSC new interface
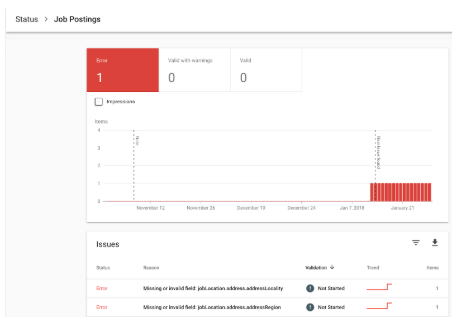
Accelerated Mobile Page (AMP) and Job posting reports use the same principle as the index coverage report with one table and graph. However, this report has only three status: Error, valid with warning and valid. Moreover, you go through the same process when you want to identify the root of the issue. Note that the Job posting assess Google’s ability to process Job Posting rich results on a website and this requires job posting structured data.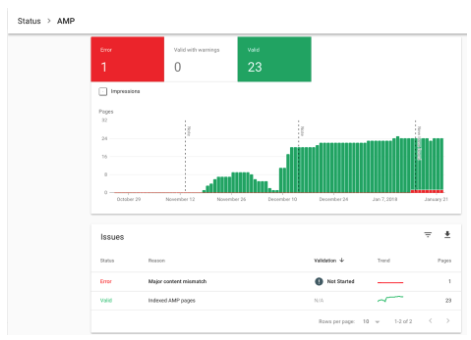
In summary, in the new interface of the Google Search Console analysing the traffic of your website has never been easier. It provides a better user experience and allows a better understanding of seasonal trends. Since you have access up to 16 months of data. The new interface has three main views: performance report, index coverage report and enhancement. The performance report is comparable to the search analytics in the old version and allows to easily filter your performance data (the dimensions still the same). The index coverage report is a combination of the Google index and Crawl reports and allows you to better understand the roots of an issue and share it with your team. The last one which is the enhancement covers for the moment AMP report and Job posting. This is definitively a glimpse of the next focus of Google in the future. The interface should evolve since the integration of all the old features is not complete. Nevertheless, we can already argue that this will have a huge impact on the way we analyse website traffic.


