Keeping an eye on the competition should be an essential part of building the strategy of your business on all fronts. Knowing your competitors' do's and don’t is necessary if you want to keep your edge and find ways to differentiate yourself in the eyes of your customer. It will give you learnings and insights on where the market is heading and point you towards new opportunities.
Best sellers report
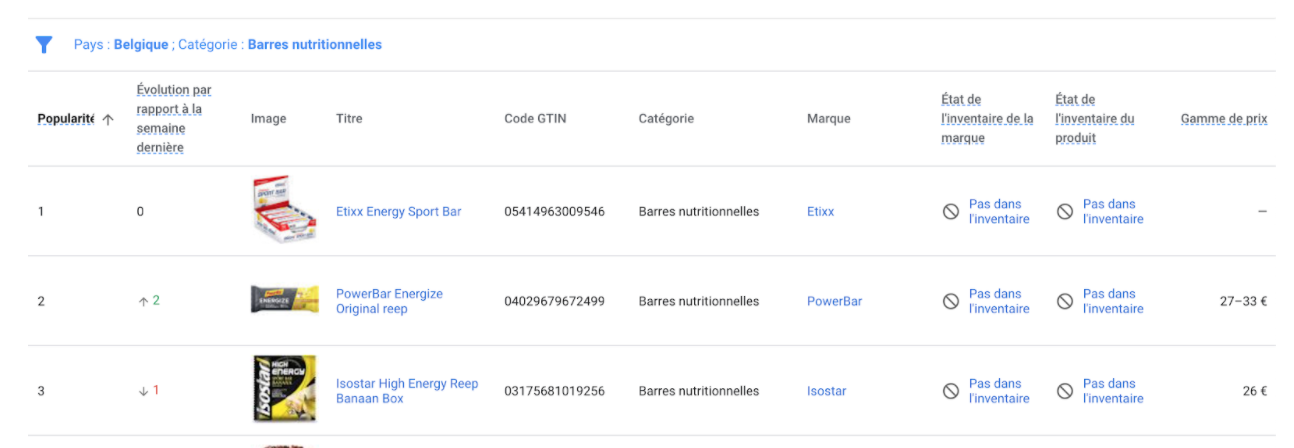
Google Merchant Center is bringing us some new tools to monitor the other players in your market. The first one being the “best sellers report”. Using this tool you can spot the most popular products and brands for different retail categories. You can filter on the country you are interested in and on the category your business is selling in. The different categories are extensive and you can filter quite detailed to find the information that matches your business. You could for example filter on health and beauty and go as deep as nutritional sports bars.


In the report, you will see the products and brands ranked by popularity in Google Shopping. This popularity is based on an estimate of Google on how much of the product or brand was sold. You will also see how a particular brand or product evolved compared to the week before. This can be very convenient if you are, for example, following up on a competing brand or product every week. Lastly, you will get an idea of the price range of a product.
Monitoring these results on a regular basis can give you insights on what products and brands are doing well in your category. You can take action on this, by, for example, adding those products to your offer or adding something similar. Brand owners can also spot that maybe they should be competing a bit harder to become one of those popular brands. Lastly, it could also be interesting to know what products and brands do well when you are expanding your business into new categories.
Price Competitiveness report
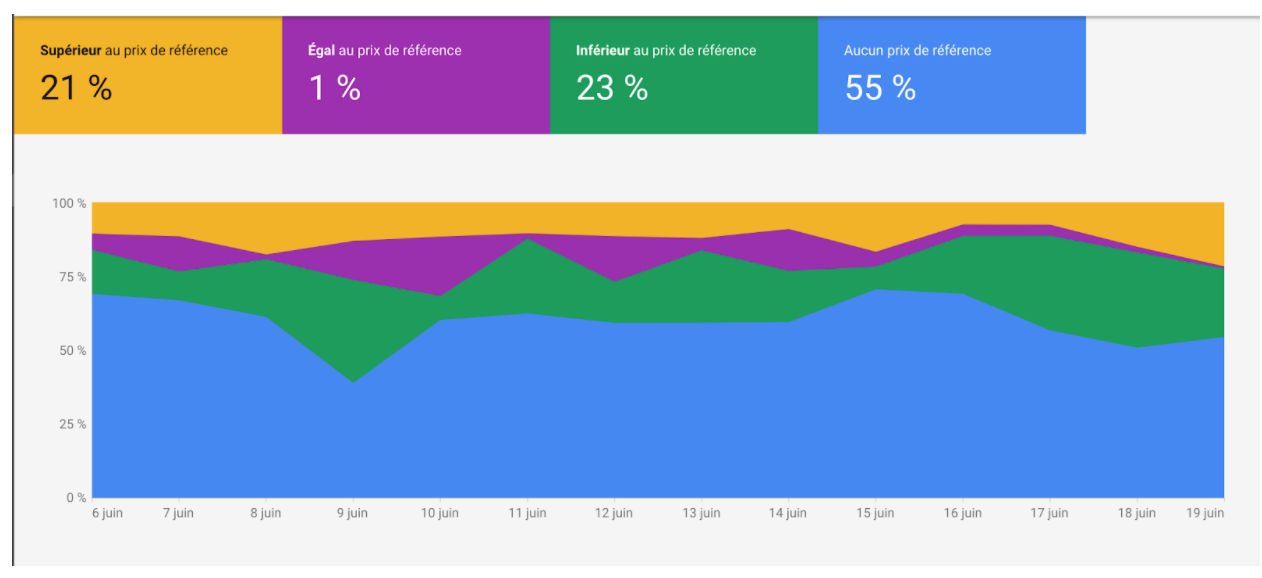
The second new tool is the “price competitiveness report”. This tool gives you an idea of how your pricing compares to your competitors. You can do this on four levels: brand, category, product, and product type. You will see what percentage of your products have a price that is higher, lower, or similar compared to a benchmark price. This benchmark price is based on the pricing from competitors weighted based on the number of clicks they receive.

If you filter based on your specific products you will see how your price compares to a benchmark, if available. You will see that benchmark below your own price and next to it the percentage difference. This is based on the current price. Prices of course fluctuate, so next to that you also have a comparison to a benchmark based on your chosen time period.
Keeping an eye on these numbers can benefit you in the following ways:
- It can give you relevant insights when you are choosing what product to put forward in your advertising campaign. You could for example attract people with one of your products that is better priced compared to your competition.
- You can also take this report into account when deciding on the pricing of your own products.
- Lastly, these numbers could also give you an idea of why your Shopping ads are performing a certain way. Maybe you saw a drop in your CTR on your Shopping ads. Seeing that your average price has increased compared to the benchmark could give you some explanation on this.
Conclusion
It’s important to follow-up on your competitor’s behavior. Google Merchant center report gives us an extra easy tool to do so. Checking the best sellers report will help you in knowing what products and brands are doing well in your category of interest. Monitoring your price competitiveness report shows you how your pricing is compared to the competition.


